In the wastewater treatment system, the aeration process accounts for 45% to 75% of the energy consumption of the entire wastewater treatment plant, in order to improve the oxygen transfer efficiency of the aeration process, the current wastewater treatment plant is commonly used in microporous aeration systems.Compared with the aeration system of large and medium-sized bubbles, the microporous aeration system can save about 50% of energy consumption. Nevertheless, the oxygen utilisation rate of its aeration process is also in the range of 20% to 30%. In addition, there have been more areas in China to use microporous aeration technology for the treatment of polluted rivers, but there is no research on how to reasonably select microporous aerators for different water conditions. Therefore, the optimisation of microporous aerator oxygenation performance parameters for the actual production and application is of great significance.
There are many factors affecting the performance of microporous aeration and oxygenation, the most important of which are the aeration volume, pore size and installation of water depth.
At present, there are fewer studies on the relationship between the oxygenation performance of microporous aerator and pore size and installation depth at home and abroad. The research focuses more on the improvement of total oxygen mass transfer coefficient and oxygenation capacity, and neglects the energy consumption problem in the aeration process. We take the theoretical power efficiency as the main research index, combined with the oxygenation capacity and the trend of oxygen utilisation, initially optimise the aeration volume, aperture diameter and installation depth when the aeration efficiency is the highest, to provide a reference for the application of microporous aeration technology in the actual project.

1.Materials and methods
1.1 Test set-up
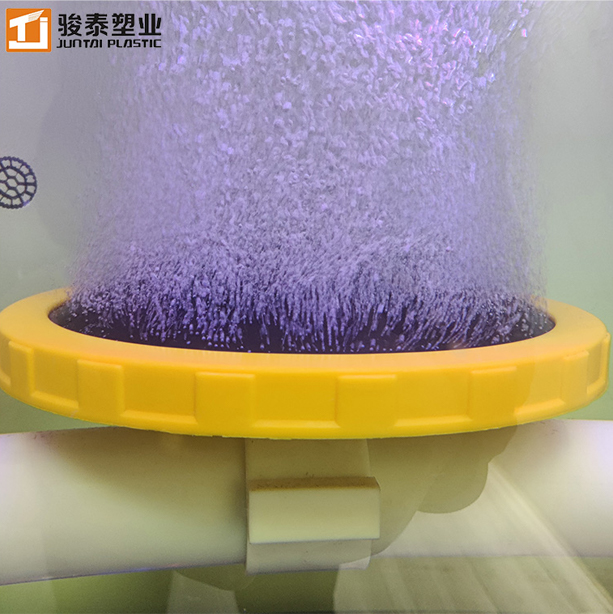
The test setup was made of Plexiglas, and the main body was a D 0.4 m × 2 m cylindrical aeration tank with a dissolved oxygen probe located 0.5 m below the water surface (shown in Figure 1).

Figure 1 Aeration and Oxygenation Test Setup
1.2 Test materials
Microporous aerator, made of rubber membrane, diameter 215 mm, pore size 50, 100, 200, 500, 1 000 μm. sension378 benchtop dissolved oxygen tester, HACH, USA. Gas rotor flow meter, range 0~3 m3/h, accuracy ±0.2%. HC-S blower. Catalyst: CoCl2-6H2O, analytically pure; Deoxidant: Na2SO3, analytically pure.

1.3 Test method
The test was conducted using the static non-stationary method, i.e., Na2SO3 and CoCl2-6H2O were first dosed for deoxygenation during the test, and aeration was started when the dissolved oxygen in the water was reduced to 0. Changes in the dissolved oxygen concentration in the water over time were recorded, and the KLa value was calculated. Oxygenation performance was tested under different aeration volumes (0.5, 1, 1.5, 2, 2.5, 3 m3/h), different pore sizes (50, 100, 200, 500, 1,000 μm), and different water depths (0.8, 1.1, 1.3, 1.5, 1.8, 2.0 m), and reference was also made to the CJ/T
3015.2 -1993 "Aerator clear water oxygenation performance determination" and the United States clear water oxygenation test standards.


2.Results and discussion
2.1 Principle of the test
The basic principle of the test is based on the double membrane theory proposed by Whitman in 1923. The oxygen mass transfer process can be expressed in equation (1).
Where: dc/dt - mass transfer rate, i.e., the amount of oxygen transferred per unit volume of water per unit time, mg/(L-s).
KLa - total oxygen transfer coefficient of the aerator at the test conditions, min-1 ;
C* - saturated dissolved oxygen in water, mg/L.
Ct - dissolved oxygen in the water at the moment of aeration t, mg/L.
If the test temperature is not at 20 °C, equation (2) can be used to correct for KLa:
The oxygenation capacity (OC, kg/h) is expressed by equation (3).
Where: V - aeration pool volume, m3.
Oxygen utilisation (SOTE, %) is expressed by equation (4).
Where: q - aeration volume in standard condition, m3/h.
The theoretical power efficiency [E, kg/(kW-h)] is expressed by equation (5).
Where: P - aeration equipment power, kW.
Commonly used indicators for evaluating the aerator oxygenation performance are total oxygen mass transfer coefficient KLa, oxygenation capacity OC, oxygen utilisation rate SOTE and theoretical power efficiency E [7]. The existing studies have focused more on the trends of total oxygen mass transfer coefficient, oxygenation capacity and oxygen utilisation, and less on the theoretical power efficiency [8, 9]. Theoretical power efficiency, as the only efficiency index [10], can reflect the energy consumption problem in the aeration process, which is the focus of this experiment.
2.2 Effect of aeration on oxygenation performance
The oxygenation performance at different aeration levels was evaluated by aeration at the bottom 2 m of the aerator with a pore size of 200 μm, and the results are shown in Fig. 2.
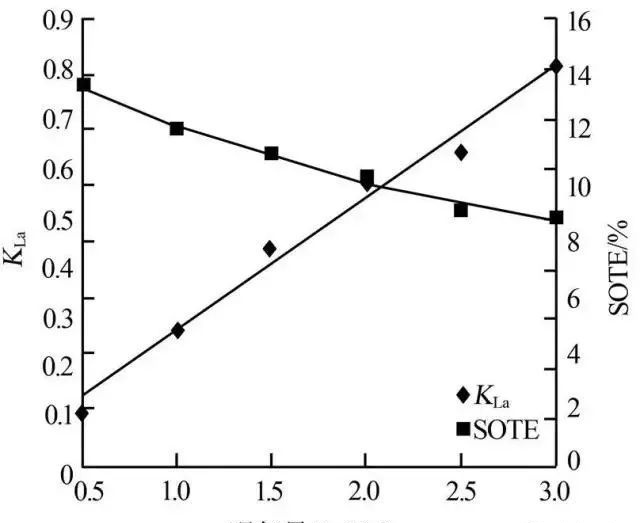
Fig. 2 Variation of K and oxygen utilisation with aeration rate
As can be seen from Fig. 2, KLa increases gradually with the increase of aeration volume. This is mainly because the larger the aeration volume, the larger the gas-liquid contact area and the higher the oxygenation efficiency. On the other hand, some researchers found that the oxygen utilisation rate decreased with the increase of aeration volume, and a similar situation was found in this experiment. This is because under a certain water depth, the residence time of bubbles in the water is increased when the aeration volume is small, and the gas-liquid contact time is prolonged; when the aeration volume is large, the disturbance of the water body is strong, and most of the oxygen is not effectively utilised, and is eventually released from the surface of the water in the form of bubbles into the air. The oxygen utilisation rate derived from this experiment was not high compared to the literature, probably because the reactor height was not high enough, and a large amount of oxygen escaped without contacting the water column, reducing the oxygen utilisation rate.
The variation of theoretical power efficiency (E) with aeration is shown in Fig. 3.
Fig. 3 Theoretical power efficiency versus aeration volume
As can be seen in Fig. 3, the theoretical power efficiency decreases gradually with increasing aeration. This is because the standard oxygen transfer rate increases with the increase of aeration volume under certain water depth conditions, but the increase in the useful work consumed by the blower is more significant than the increase in the standard oxygen transfer rate, so the theoretical power efficiency decreases with the increase of aeration volume within the range of aeration volume examined in the experiment. Combining the trends in Figs. 2 and 3, it can be found that the best oxygenation performance is achieved at an aeration volume of 0.5 m3/h.
2.3 Effect of pore size on oxygenation performance
Pore size has a great influence on the formation of bubbles, the larger the pore size, the larger the size of the bubble. Bubbles on the oxygenation performance of the impact is mainly manifested in two aspects: First, the smaller the individual bubbles, the larger the overall bubble specific surface area, the larger the gas-liquid mass transfer contact area, the more conducive to the transfer of oxygen; Secondly, the larger the bubbles, the stronger the role of stirring the water, the gas-liquid mixing between the faster, the better the effect of oxygenation. Often the first point in the mass transfer process plays a major role. The test will be aeration volume set to 0.5 m3/h, to examine the effect of pore size on KLa and oxygen utilisation, see Figure 4.
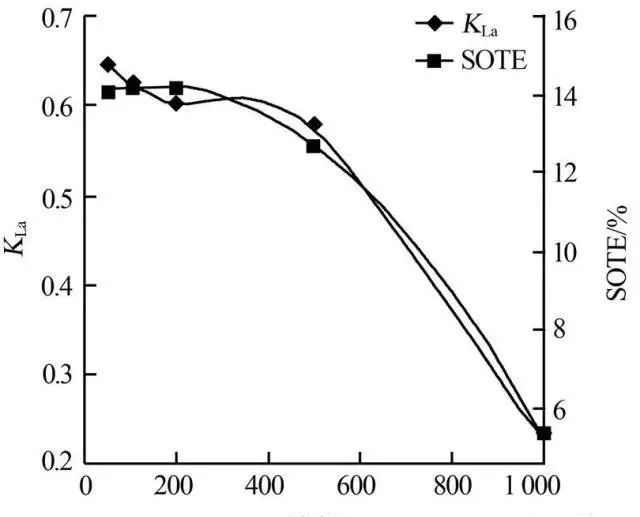 Figure 4. Variation curves of KLa and oxygen utilisation with pore size
As can be seen from Fig. 4, both KLa and oxygen utilisation decreased with the increase of pore size. Under the condition of the same water depth and aeration volume, the KLa of 50 μm aperture aerator is about three times of that of 1,000 μm aperture aerator. Therefore, when the aerator is installed in a certain depth of water, the smaller the aperture of the aerator oxygenation capacity and oxygen utilisation is greater.
The variation of theoretical power efficiency with pore size is shown in Fig.

As can be seen from Fig. 5, the theoretical power efficiency shows a trend of increasing and then decreasing with the increase of aperture size. This is because on the one hand, the small aperture aerator has a larger KLa and oxygenation capacity, which is conducive to oxygenation. On the other hand, the resistance loss under a certain water depth increases with the decrease of aperture diameter. When the pore size reduction on the resistance loss of the promotion effect is greater than the role of oxygen mass transfer, the theoretical power efficiency will be reduced with the reduction of pore size. Therefore, when the aperture diameter is small, the theoretical power efficiency will increase with the increase of aperture diameter, and the aperture diameter of 200 μm to reach the maximum value of 1.91 kg/(kW-h); when the aperture diameter > 200 μm, the resistance loss in the aeration process no longer plays a dominant role in the aeration process, the KLa and the oxygenation capacity with the increase in aperture diameter of the aerator will be reduced, and therefore, the theoretical power efficiency shows a significant downward trend.
2.4 Effect of installation water depth on oxygenation performance
The depth of water in which the aerator is installed has a very significant effect on the aeration and oxygenation effect. The target of the experimental study was a shallow water channel of less than 2 m. The aeration depth of the aerator was determined by the water depth of the pool. Existing studies mainly focus on the submerged depth of the aerator (i.e., the aerator is installed at the bottom of the pool, and the water depth is increased by increasing the amount of water), and the test mainly focuses on the installation depth of the aerator (i.e., the amount of water in the pool is kept constant, and the installation height of the aerator is adjusted to find the best depth of water for aeration effect), and the changes of KLa and oxygen utilisation with the depth of water are shown in Fig. 6.
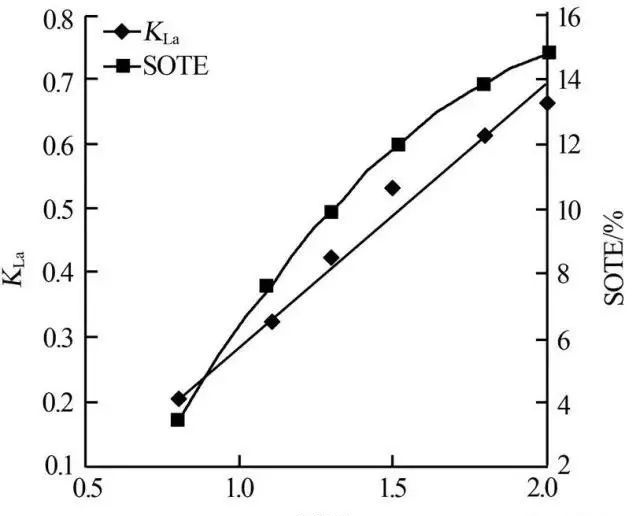 Fig. 6 Variation curves of K and oxygen utilisation with water depth
Figure 6 shows that with the increase of water depth, both KLa and oxygen utilisation show a clear increasing trend, with KLa differing by more than four times at 0.8 m water depth and 2 m water depth. This is because the deeper the water, the longer the residence time of the bubbles in the water column, the longer the gas-liquid contact time, the better the oxygen transfer effect. Therefore, the deeper the aerator is installed, the more conducive to the oxygenation capacity and oxygen utilisation. But the installation of water depth increases at the same time resistance loss will also increase, in order to overcome the resistance loss, it is necessary to increase the amount of aeration, which will inevitably lead to an increase in energy consumption and operating costs. Therefore, in order to obtain the optimal installation depth, it is necessary to evaluate the relationship between theoretical power efficiency and water depth, see Table 1.
|
Table 1 Theoretical power efficiency as a function of water depth
|
|
Depth/m
|
E/(kg.kw-1.h-1)
|
Depth/m
|
E/(kg.kw-1.h-1)
|
|
0.8
|
0.50
|
1.1
|
1.10
|
Table 1 shows that the theoretical power efficiency is extremely low at an installation depth of 0.8 m, with only 0.5 kg/(kW-h), making shallow water aeration inappropriate. Installation of water depth of 1.1 ~ 1.5 m range, due to the significant increase in oxygenation capacity, while the aerator by the resistance effect is not obvious, so the theoretical power efficiency increases rapidly. As the water depth increases further to 1.8 m, the effect of resistance loss on the oxygenation performance becomes more and more significant, resulting in the growth of the theoretical power efficiency tends to level off, but still shows an increasing trend, and in the installation of the water depth of 2 m, the theoretical power efficiency reaches a maximum of 1.97 kg/(kW-h). Therefore, for channels < 2 m, bottom aeration is preferred for optimal oxygenation.
3.Conclusion
Using the static non-stationary method for microporous aeration clear water oxygenation test, in the test water depth (< 2 m) and pore size (50 ~ 1 000 μm) conditions, the total oxygen mass transfer coefficient KLa and oxygen utilisation increased with the installation of the water depth; with the increase in pore size and decreased. In the process of increasing the aeration volume from 0.5 m3/h to 3 m3/h, the total oxygen mass transfer coefficient and oxygenation capacity gradually increased, and the oxygen utilisation rate decreased.
Theoretical power efficiency is the only indicator of effectiveness. In the test conditions, the theoretical power efficiency with the aeration and installation of water depth increases, with the increase in aperture first increase and then decrease. Installation of water depth and aperture should be a reasonable combination in order to make the oxygenation performance to achieve the best, in general, the greater the depth of water selection of the aerator aperture the larger.
The test results indicate that shallow water aeration should not be used. At an installation depth of 2 m, an aeration volume of 0.5 m3/h and an aerator with a pore size of 200 μm resulted in a maximum theoretical power efficiency of 1.97 kg/(kW-h).
The above is our R & D data, committed to data to continuously optimizing product performance, from the root to solve the aeration disk aperture, EPDM membrane skin easy to rupture, clogging, and other issues.
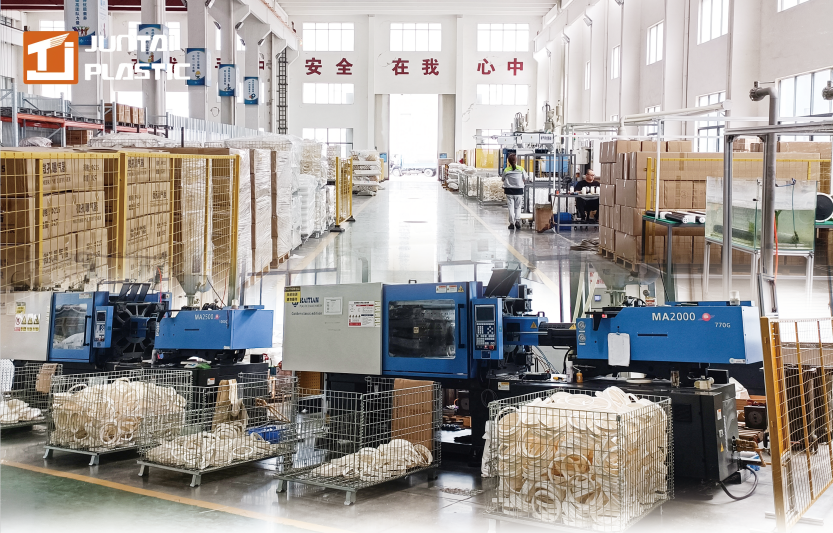
NIHAO is the first company in China to develop rubber and plastic products for more than twenty years as a senior
leader in the water treatment industry, with a professional research and development team and specialized factory equipment to enhance the accuracy and productivity of the products.
We specialize in manufacturing
tube duffuser and
Disc duffuser over 10 years. Aeration disc membrane skin we use the exclusive oil-free formula, after the R & D team's continuous testing and improvement of our overall enhancement of the comprehensive performance of the membrane skin, the use of up to eight years of microporous non-clogging. Not only the use of high-quality EPDM 100% new material but also added 38% of the proportion of carbon black, through different force diameters to fully expand the membrane skin resilience performance and tear resistance to strengthen. Our Disc Diffuser has the following advantages:
1. Anti-blocking, good backflow prevention, large contact area, strong corrosion resistance
2. Strong membrane skin tear resistance, water resistance, better impact resistance
3. Uniform bubbles, high-efficiency aeration, high oxygen utilization, energy saving, effectively reducing operating costs
Advantages of Aeration Tube:
Easy to assemble, in the bottom of the pool pipe and aeration pipe into one, do not need additional piping equipment, the price is lower than other microporous aerator. The same acid and alkali resistance, not easy to aging, long operating life. In the aeration bulge, not aeration is flattened, flattened, variable microporous was closed, so the suspension of aeration for a long period of time, will not be clogged.
NIHAO professional team and R & D staff, to provide you with the actual scene design, reasonable specifications to choose the best applicable to your aerator! We sincerely look forward to contacting you to create a better and cleaner future!


 English
 عربى
عربى
 Español


 +86-15267462807


