

 English
 عربى
عربى
 Español


×
Password
Get password
Enter password to download relevant content.
Submit
 +86-15267462807
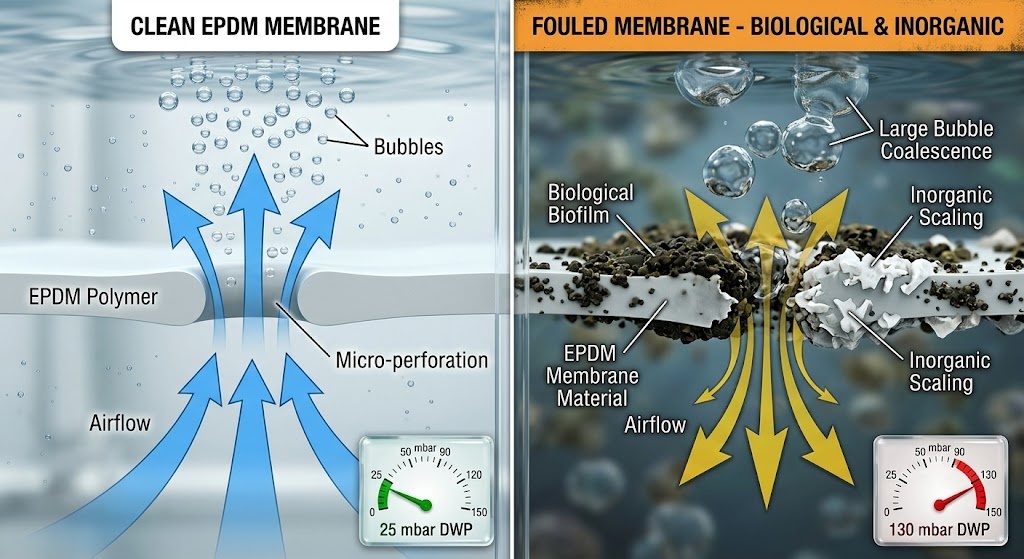
Direct answer: Dynamic Wet Pressure (DWP) is the pressure drop across a submerged diffuser membrane while air is flowing — it is the single most reliable indicator of diffuser health. A new EPDM disc diffuser has a DWP of 10–30 mbar. When DWP rises above 50–70 mbar, fouling is reducing oxygen transfer and wasting blower energy. When DWP exceeds 100 mbar and does not recover after cleaning, the membrane is aged and needs replacement. You do not need to drain the tank to know this — you can calculate DWP from the blower room in under five minutes.
Most operators think about blower discharge pressure as a single number. In reality, it is the sum of four components:
Total blower discharge pressure = Hydrostatic head + Pipe friction losses + Header/lateral losses + DWP
This means that if total blower discharge pressure is rising at constant airflow and constant tank depth, the cause is almost certainly rising DWP — the diffusers are fouling or ageing.
You do not need a pressure sensor on the diffuser. The standard field method uses readings from the blower room:
DWP = P_blower - P_hydrostatic - P_pipe
Step by step:
Step 1 — Read blower discharge pressure
Take the gauge pressure reading at the blower outlet (or the nearest pressure tap on the main air header). Record in mbar or kPa.
Step 2 — Calculate hydrostatic head
Hydrostatic head (mbar) = water depth above diffusers (m) × 98.1
Example: diffusers at 5.5 m depth → 5.5 × 98.1 = 540 mbar
Step 3 — Estimate pipe losses
For a well-designed aeration system at normal operating flow, pipe friction + fitting losses are typically 30–60 mbar total. Use the design value from the original system documentation, or measure it by taking a pressure reading just above the diffuser grid during a clean-water commissioning test.
Step 4 — Calculate DWP
DWP = P_blower - hydrostatic head - pipe losses
Worked example:
130 mbar is well above the 50–70 mbar warning threshold — this system needs cleaning or membrane inspection.
| DWP (mbar) | Condition | Interpretation | Action |
|---|---|---|---|
| 5–30 | New / just cleaned | Excellent — membrane fully open | None |
| 30–50 | Normal operation (0–12 months) | Good — minor biological film forming | Monitor monthly |
| 50–70 | Early fouling warning | SOTE declining ~5–10% | Schedule cleaning within 3 months |
| 70–100 | Moderate fouling | SOTE declining 10–20%, blower energy rising | Clean within 4–6 weeks |
| 100–150 | Severe fouling or early ageing | SOTE declining 20–35%, blower nearing pressure limit | Clean immediately; assess membrane condition |
| > 150 | Severe ageing or scaling | Membrane stiff — DWP will not fully recover after cleaning | Plan membrane replacement |
Values for EPDM disc diffusers at standard operating air flux (2–6 Nm³/hr per disc). Adjust thresholds ±20% for silicone or tube diffuser formats.
Rising DWP is not one problem — it is three different problems with different causes, different cleaning responses, and different long-term implications. Treating them identically is the most common maintenance mistake.
What it is: A biofilm of bacteria, fungi, and extracellular polysaccharides accumulates on the outer membrane surface. The film blocks some micro-perforations and increases resistance to airflow.
Rate of rise: Gradual — typically 1–3 mbar/month in normal municipal wastewater. Faster in high-BOD industrial applications, intermittent-operation systems where biofilm grows during idle periods, or integrated fixed-film activated sludge (IFAS) and MBBR co-aeration systems where biofilm fragments detach from carriers and deposit directly onto diffuser membrane surfaces.
DWP signature: Slow, steady increase over months. DWP rises proportionally with time in service.
Cleaning response: High airflow burst (surge cleaning) — momentarily increasing air to maximum rated flux for 15–30 minutes. The membrane stretches beyond its normal operating aperture, mechanically cracking the biofilm layer. DWP typically drops 20–40 mbar after a successful burst clean. For thicker biofilms, a hypochlorite soak (1,000–2,000 mg/L free chlorine, 4–8 hours) is more effective.
Long-term implication: Fully reversible if managed proactively. Biological fouling does not permanently damage the membrane.
What it is: Calcium carbonate (from hard water), silica, calcium phosphate, and iron deposits precipitate on the membrane surface and inside the micro-perforations. Unlike biofilm, scaling is rigid — it does not flex with the membrane and progressively restricts pore opening.
Rate of rise: Faster than biological fouling in hard water. At 400 mg/L hardness (as CaCO₃), EPDM membrane DWP increased by 126%, silicone by 34%, and polyurethane by 304% within 50 days — though the rate of increase slowed significantly during the subsequent 60 days of operation.
DWP signature: Faster initial rise than biological fouling, then plateaus partially as outer surface scaling reaches equilibrium. A key diagnostic sign: DWP recovers less completely after burst cleaning than with biological fouling alone.
Cleaning response: Acid cleaning — citric acid (2–5% solution) or dilute hydrochloric acid (1–2%) circulated through the diffuser grid or applied by drain-down soak. Acid dissolves CaCO₃ deposits. Must be followed by thorough water rinse before returning to service. For in-situ cleaning without dewatering, citric acid injection into the air supply line is an option — acid mist contacts the membrane from inside the perforations.
Long-term implication: Partially reversible. Early-stage scaling (< 6 months) is largely removable. Long-term mineral deposits that have calcified deeply into pore channels may cause permanent DWP increase even after acid cleaning.
Water hardness and membrane selection:
| Water hardness | EPDM DWP risk | Silicone DWP risk | Recommendation |
|---|---|---|---|
| < 150 mg/L CaCO₃ | Low | Very low | Either membrane |
| 150–300 mg/L CaCO₃ | Moderate | Low | EPDM acceptable; silicone preferred |
| 300–500 mg/L CaCO₃ | High | Moderate | Silicone strongly preferred |
| > 500 mg/L CaCO₃ | Very high | High | PTFE-coated EPDM or silicone + quarterly cleaning |
What it is: EPDM membranes contain plasticizer oils that keep the rubber flexible. Over years of operation, these oils leach into the wastewater. As plasticizer content falls, the membrane becomes stiffer — it requires more pressure to stretch the same distance and open the same pore aperture. This is measured as an increase in Shore A hardness.
Rate of rise: Slow — typically over 3–10 years of continuous operation. Accelerated by high temperatures (>30°C), high-pH wastewater (pH > 9), and exposure to oils/solvents.
DWP signature: Research on diffusers after 1.5 to 15 years in operation found that ageing actually led to a reduced DWP of 5–10 mbar in some cases — but caused up to 25% SOTE loss, which was greater than the SOTE loss attributable to fouling alone (below 12%). This counterintuitive finding means ageing can degrade oxygen transfer performance significantly without producing a dramatic DWP spike — making it harder to detect through pressure monitoring alone.
Key diagnostic: DWP after full acid + hypochlorite cleaning that does not return to near-new values (< 40 mbar) indicates membrane stiffening from ageing — not just fouling. Confirm by measuring Shore A hardness directly: new EPDM membrane is typically Shore A 40–50; aged membrane exceeding Shore A 65–70 has lost significant elasticity.
Cleaning response: None effective. Ageing is irreversible. Once DWP after cleaning exceeds 80–100 mbar persistently, schedule membrane replacement.
A single DWP reading tells you the current state. A step test tells you whether the diffusers are healthy or failing under load — and catches early fouling before it becomes severe.
Procedure:
Interpreting the curve:
| Curve shape | Diagnosis |
|---|---|
| Gentle, linear slope — DWP rises proportionally with flow | Healthy system — normal operating resistance |
| Steep slope — DWP rises faster than flow increases | Fouling present — pores are partially blocked, choking under load |
| Flat at low flow, then sharply steep at high flow | Severe scaling or ageing — perforations blocked; only some open under high pressure |
| Irregular / erratic — no smooth curve | Non-uniform fouling across the diffuser grid, or one zone severely more fouled than others |
A healthy fine bubble disc diffuser at rated airflow (4 Nm³/hr per disc) should produce a DWP of 20–40 mbar. If the step test curve shows DWP exceeding 60 mbar at rated flow, proactive cleaning is warranted.
Rising DWP does not just strain the blower — it simultaneously reduces the oxygen transfer efficiency of the diffusers. The two effects compound each other:
Effect 1 — Blower works harder: Higher DWP means higher total blower discharge pressure required to maintain the same airflow. Since blower power consumption scales approximately linearly with pressure, a 50 mbar DWP increase at 600 mbar baseline total pressure represents roughly an 8% blower energy increase for the same airflow.
Effect 2 — SOTE falls: Fouled membranes produce larger, less uniform bubbles. Larger bubbles have lower surface-area-to-volume ratio and shorter residence time in the water column — both reduce oxygen transfer per unit of air.
Combined impact of fouling on a 10,000 m³/day plant (indicative):
| DWP level | SOTE (relative) | Blower energy (relative) | Annual energy cost premium |
|---|---|---|---|
| 20 mbar (new) | 100% | 100% | Baseline |
| 50 mbar (6–12 months) | ~92% | ~108% | +$8,000–15,000/yr |
| 100 mbar (fouled) | ~80% | ~118% | +$25,000–45,000/yr |
| 150 mbar (severely fouled) | ~65% | ~130% | +$50,000–80,000/yr |
Costs indicative at $0.08/kWh electricity, 200 kW baseline blower load.
This is why maintenance supervisors must trend DWP via SCADA — a gradual increase in blower discharge pressure, for example rising from 7.0 psi to 8.5 psi over six months at constant flow, is the early warning system for severe diffuser fouling. Waiting until DO alarms trigger means the problem has already been costing money for months.
| Approach | Cost | Frequency | Sensitivity | Best for |
|---|---|---|---|---|
| Manual blower gauge reading | Very low | Monthly or quarterly | Low — misses gradual trends | Small plants, <5 aeration zones |
| Portable pressure datalogger on blower header | Low | Continuous during logging periods | Medium — good for trend capture | Medium plants, periodic audits |
| Fixed pressure transmitter + SCADA trend | Medium | Continuous | High — catches gradual and sudden changes | Municipal plants >5,000 m³/day |
| Per-zone pressure monitoring on lateral headers | High | Continuous | Very high — identifies which zone is fouling | Large plants, multiple independent zones |
Minimum recommended practice: Monthly manual DWP calculation from blower gauge readings, logged in a trending spreadsheet. If DWP increases by more than 20 mbar in any one month, or exceeds 70 mbar total, initiate cleaning within 4 weeks.
Best practice for municipal plants: Continuous SCADA trending of blower discharge pressure normalized to airflow rate. Set an alert when the pressure-normalized DWP index rises 15% above the post-cleaning baseline.
When DWP is rising — follow this sequence:
| Measurement | Formula / Method |
|---|---|
| Calculate DWP | DWP = P_blower - (depth × 98.1 mbar/m) - pipe losses |
| DWP warning threshold | > 50–70 mbar (EPDM disc diffuser) |
| DWP replacement threshold | > 100 mbar persistent after cleaning |
| Fouling type indicator | Burst clean recovers DWP → biological; acid clean needed → scaling; neither recovers → ageing |
| Monitoring frequency | Monthly manual minimum; continuous SCADA for plants > 5,000 m³/day |
| Step test | Increase flow in 10–15% increments; plot DWP vs. flow; steep curve = fouled |
Related: Nihao’s EPDM and silicone disc diffusers, tube diffusers, plate diffusers, and aeration hose are all designed with dynamic orifice membranes that resist fouling and support burst-air self-cleaning. For systems in hard water areas (>300 mg/L CaCO₃), Nihao’s silicone membrane diffusers provide significantly lower scaling-related DWP rise than standard EPDM. Contact us for membrane selection guidance.

86-15267462807


86-15267462807
