

 English
 عربى
عربى
 Español


×
Password
Get password
Enter password to download relevant content.
Submit
 +86-15267462807
In biological wastewater treatment, the activated sludge process is often treated as a mathematical certainty. However, seasoned process engineers know it behaves more like a volatile ecosystem. At the heart of managing this ecosystem is the Food-to-Microorganism (F/M) ratio.
While standard operational manuals offer rigid formulas, true process mastery requires understanding how F/M interacts with variable organic chemistry, seasonal kinetics, and real-time sensor limitations. This guide moves beyond basic calculations to deliver actionable, field-tested insights for modern plant optimization.
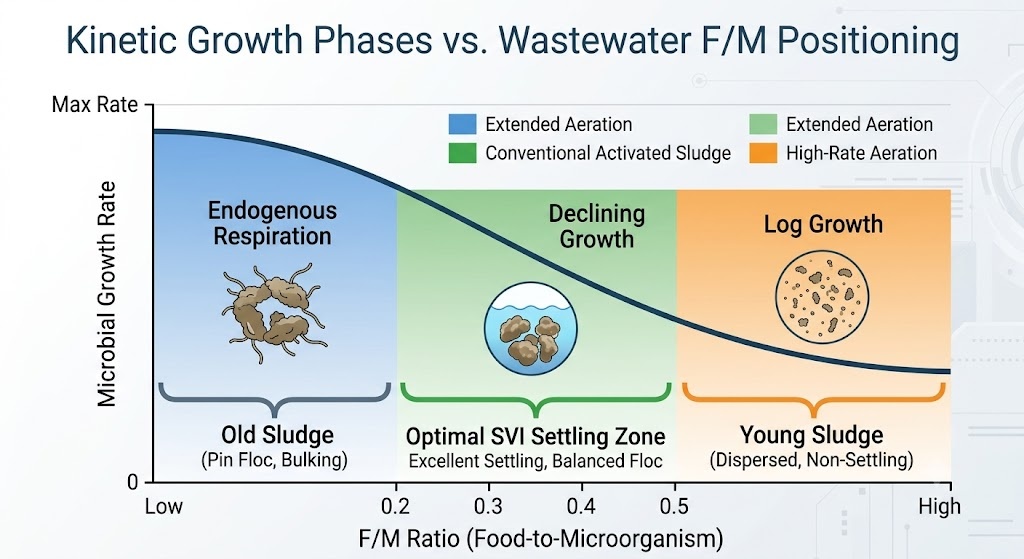
The F/M ratio defines the thermodynamic relationship between the mass of biodegradable organic substrate entering the biological reactors and the mass of active heterotrophic bacteria dedicated to stabilization.
In an ideal system, this ratio maintains bacteria in the late declining growth phase or early endogenous respiration phase. If the scale tips too far in either direction, the physical structure of the sludge floc degrades, altering the Sludge Volume Index (SVI) and risking regulatory non-compliance for total suspended solids (TSS) and nutrient limits.
The textbook mathematical representation of F/M is straightforward, but its components hide operational traps.
US Imperial Units:
F/M = (Influent BOD, mg/L * Flow, MGD * 8.34) / (MLVSS, mg/L * Basin Volume, MG * 8.34)
Metric Units:
F/M = (Influent BOD, mg/L * Flow, m3/day) / (MLVSS, mg/L * Basin Volume, m3 * 1,000)
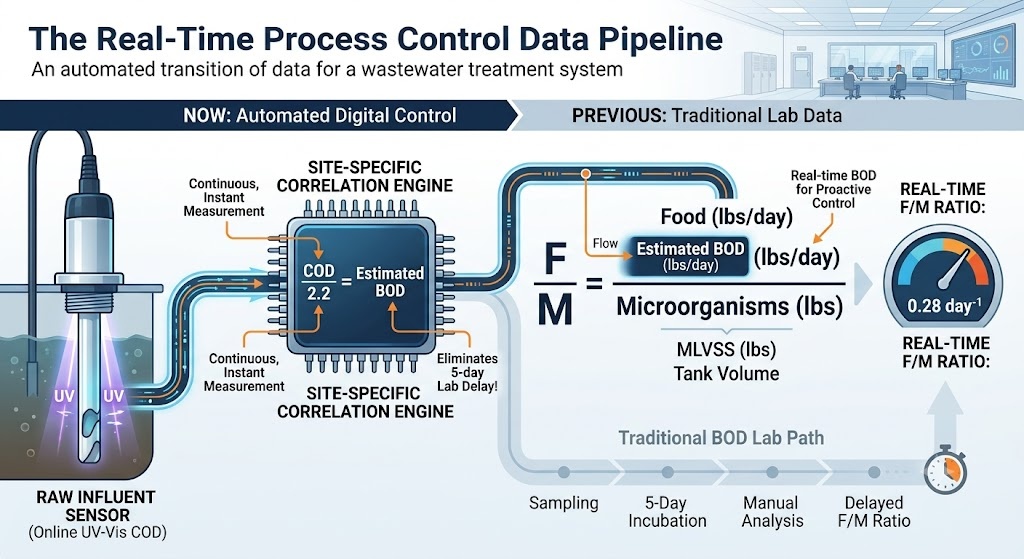
The greatest flaw in classic F/M control is that standard BOD5 requires a 5-day incubation period. Managing a dynamic plant using a 5-day lagging indicator ensures you are always fixing last week’s crisis.
Advanced facilities bypass this by establishing a dynamic COD-to-BOD or TOC-to-BOD correlation matrix. Raw domestic municipal influent typically exhibits a COD:BOD ratio of 2.0:1 to 2.5:1. However, if your facility receives industrial fractions (e.g., food processing, chemical manufacturing), this ratio can spike to 4.0:1 or shift hourly.
[Real-Time Food Estimate] = Daily COD (via 2-hour digestion or online UV-Vis) / Site-Specific Correlation Factor
By utilizing online UV-Vis spectrophotometers at the primary effluent weir, operators can capture real-time organic “slugs” and adjust process metrics immediately, rather than discovering a toxic overload five days too late.
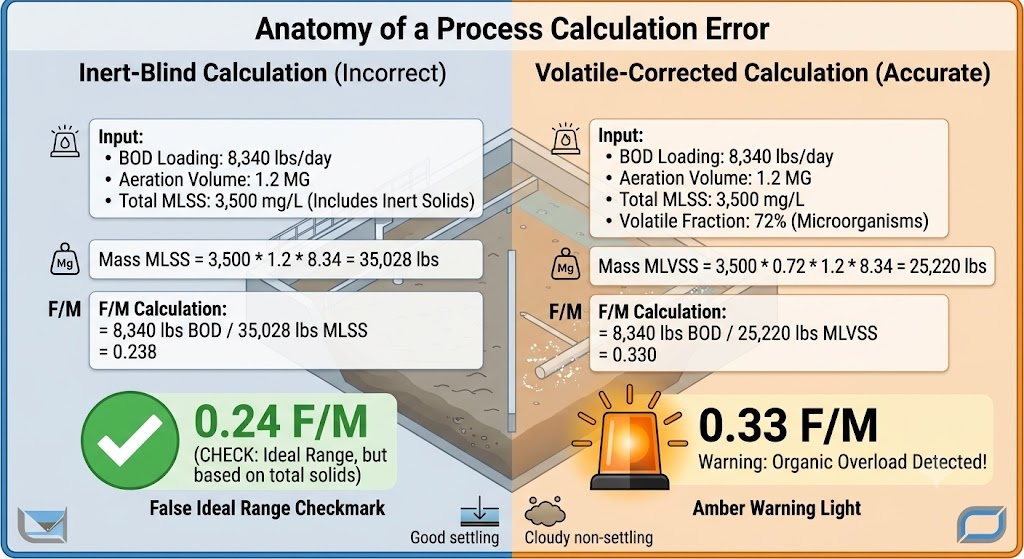
Substituting MLSS for MLVSS in the denominator is a critical mistake. MLSS includes non-biological inert solids (fixed suspended solids like fine grit, silt, and precipitated phosphorus).
A healthy municipal plant maintains an MLVSS/MLSS ratio (Purity Index) of 0.75 to 0.85. During heavy rain events in combined sewer systems, or in plants with inadequate grit channels, inert grit scours into the aeration basin, dropping the ratio below 0.60. If you do not test for the volatile fraction (MLVSS via volatile muffle furnace testing at 550 degrees Celsius), you will mathematically overestimate your microbial workforce, drastically underfeed your system, and trigger unexpected biomass starvation.
Let’s look beyond basic municipal calculations to an advanced scenario where an industrial food processing plant dumps an unexpected organic surge into a municipal system.
Estimated Influent BOD = 600 mg/L COD / 2.4 = 250 mg/L BOD
Food Applied = 250 mg/L * 4.0 MGD * 8.34 = 8,340 lbs of BOD/day
True MLVSS Concentration = 3,500 mg/L MLSS * 0.72 = 2,520 mg/L MLVSS
Active Microorganisms = 2,520 mg/L * 1.2 MG * 8.34 = 25,220 lbs of MLVSS
F/M Ratio = 8,340 lbs BOD / 25,220 lbs MLVSS = 0.33 day^-1
Operational Insight: If the operator had incorrectly used total MLSS for the calculation, the calculated F/M would have appeared as 0.24, signaling a perfectly stable conventional system. In reality, the true biological load is at 0.33—approaching the upper limit of conventional treatment, warning the operator to suppress sludge wasting immediately to prevent biomass washout.
Operating target ranges must align with the specific engineering design of the facility.
| System Typology | Standard F/M Range (lb BOD / lb MLVSS / day) | Biokinetics & Volumetric Organic Loading |
|---|---|---|
| Conventional Activated Sludge | 0.20 to 0.50 | Moderate HRT (4-8 hours). Rapid carbonaceous oxidation with stable macro-floc formation. |
| Extended Aeration (Oxidation Ditches) | 0.05 to 0.15 | High HRT (18-36 hours). Operates in endogenous decay; auto-digestion reduces secondary yield. |
| Contact Stabilization | 0.20 to 0.60 | Bimodal tank design. Uses biosorption in a small contact tank, followed by stabilization. |
| High-Rate Aeration / Carbonaceous Stage | 0.40 to 1.50+ | Low HRT (1-3 hours). Highly unstable; optimized purely for rapid soluble carbon removal. |
Microbial enzymatic activity is highly temperature-dependent, governed by the modified Arrhenius equation. For every 10 degrees Celsius drop in wastewater temperature, biological metabolic rates decrease by roughly 50%.
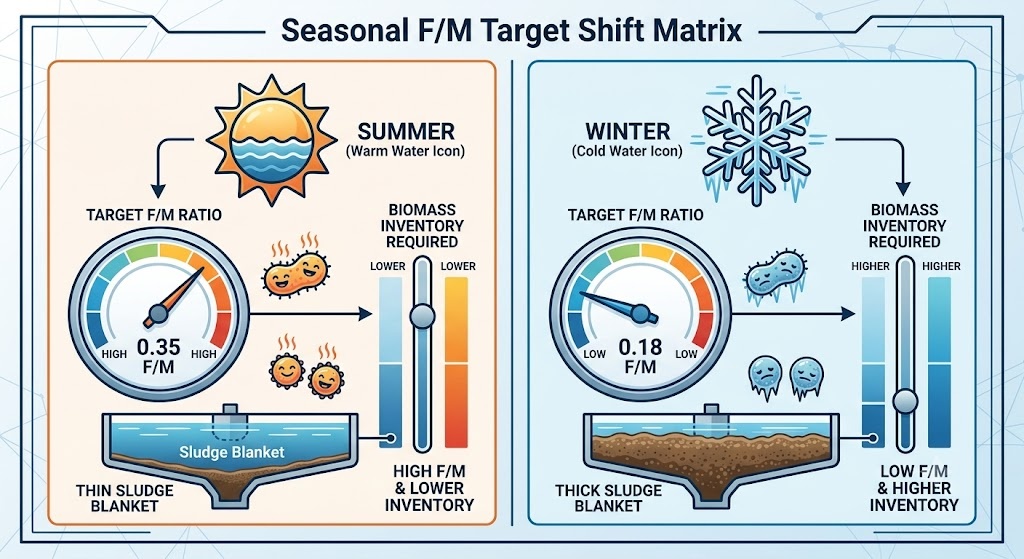
A high F/M ratio (>0.50 in conventional systems) indicates that the available carbonaceous energy exceeds the metabolic capacity of the standing biomass. This stems from industrial slug dumps, sudden storm-water hydraulic washouts of solids, or excessive Sludge Wasting (WAS).

A low F/M ratio (<0.15 in conventional systems) represents an environment of intense biological starvation. The microbial population has outgrown its primary energy supply.
When food is scarce, filamentous bacteria outcompete standard floc-forming bacteria. Filamentous cells have a much higher surface-area-to-volume ratio, allowing them to scavenge trace amounts of BOD more effectively than dense flocs. As they multiply, they create a web-like mesh that traps water, driving up the Sludge Volume Index (SVI) and causing the sludge blanket in the clarifier to rise toward the surface.

Advanced wastewater operations do not manage F/M as an isolated metric. It functions as the mathematical inverse of Mean Cell Residence Time (MCRT) or Solids Retention Time (SRT).
While F/M measures the external stressor (food entering the system), MCRT measures the internal age and retention time of the workforce.
MCRT = Total Inventory of Volatile Suspended Solids in System / Total Mass of Volatile Solids Wasted & Effluent Lost per Day
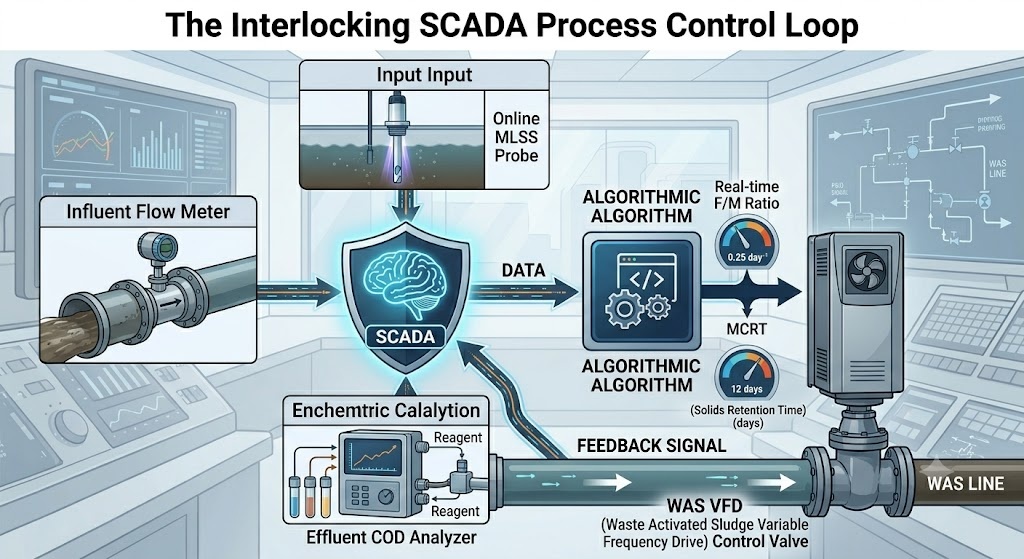
Modern treatment facilities utilize a unified Process Control Matrix within their SCADA systems. Online optical MLSS probes installed at the midpoint of the aeration basin provide continuous solids data. Combined with digital magnetic flowmeters on the influent and WAS lines, the SCADA system automatically modulates variable-frequency drive (VFD) wasting pumps to maintain a steady target MCRT.
When a sudden industrial load shifts the F/M ratio, the automation detects the corresponding drop in dissolved oxygen (DO) demand and adjustments can be made immediately. This integration ensures that MCRT acts as the anchor for stability, while F/M serves as the diagnostic tool to evaluate real-time loading variations.
Optimizing an activated sludge plant requires moving past historical rule-of-thumb methodologies and embracing dynamic process metrics:

86-15267462807


86-15267462807
