

 English
 عربى
عربى
 Español


×
Password
Get password
Enter password to download relevant content.
Submit
 +86-15267462807
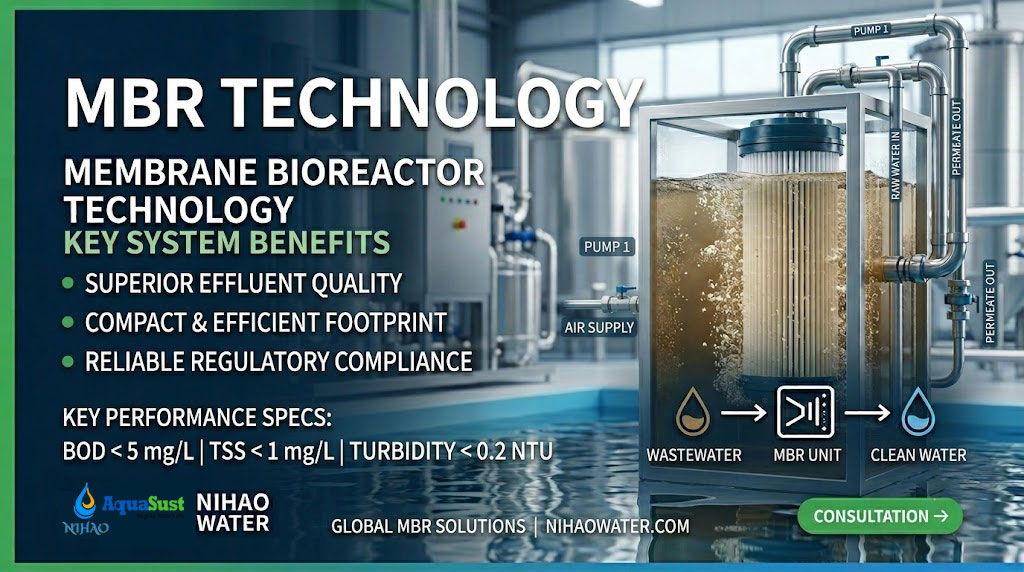
Membrane bioreactor (MBR) technology has become the system of choice for engineers and project managers who need high-quality effluent, a compact footprint, and a direct path to water reuse compliance. This guide goes beyond textbook definitions. It covers the process mechanics, design calculations, operational protocols, cost benchmarks, and U.S. regulatory considerations that engineering teams actually need when evaluating, specifying, or operating an MBR system.
A membrane bioreactor couples two well-established unit operations — activated sludge biological treatment and pressure-driven membrane filtration — into a single integrated process. In a conventional activated sludge (CAS) system, liquid-solids separation relies on gravity settling in a secondary clarifier, which imposes constraints on mixed liquor suspended solids (MLSS) concentration and effluent turbidity. MBR eliminates the clarifier entirely and replaces it with microfiltration (MF) or ultrafiltration (UF) membranes with nominal pore sizes of 0.01–0.4 µm, producing a consistently clear permeate regardless of sludge settleability.
Two primary configurations are used in practice:
Submerged (immersed) MBR places the membrane modules directly inside the biological reactor or in an adjacent membrane tank flooded with mixed liquor. Permeate is withdrawn by applying a slight vacuum (typically 10–50 kPa TMP). Airflow from coarse-bubble diffusers positioned below the membranes scours the membrane surface continuously, limiting cake layer formation and maintaining flux. Design flux for submerged systems typically falls in the range of 10–30 LMH (liters per square meter per hour) under steady municipal conditions.
Side-stream (external) MBR recirculates mixed liquor from the bioreactor to an external membrane module operating at higher crossflow velocity and elevated TMP (100–400 kPa). This configuration achieves higher instantaneous flux (30–100+ LMH) but carries a significantly higher energy penalty due to the recirculation pumps. Side-stream configurations are more common in industrial applications with high-strength or viscous feed streams where fouling control through high shear is required.
Key operating parameters that define MBR performance:
In a typical U.S. municipal installation treating 0.5–5 MGD, the flow path runs: headworks screening → anoxic/aerobic bioreactor → membrane tank → permeate effluent storage → disinfection. Monitoring points include continuous TMP, online turbidity or particle counting on the permeate, DO in the bioreactor, MLSS, and differential pressure across air supply headers.
The following step-by-step sizing example is based on a design flow of 1,000 m³/day (0.26 MGD) treating municipal wastewater with typical influent characteristics: BOD₅ = 220 mg/L, TSS = 250 mg/L, TKN = 40 mg/L.
MBR systems require a long SRT to maintain stable nitrification and manage membrane fouling through biomass conditioning. A typical design SRT is 15–25 days for municipal applications; use 20 days as the working value.
HRT in an MBR can be significantly shorter than CAS because the membrane retains all solids regardless of settleability. A bioreactor HRT of 4–6 hours is common for municipal wastewater. Use HRT = 5 hours.
Bioreactor volume:
V = Q × HRT = 1,000 m³/d × (5 h ÷ 24 h/d) = 208 m³
Apply a safety factor of 1.2 for flow equalization and peak loading:
V_design = 208 × 1.2 = ~250 m³
Assume operating MLSS = 10,000 mg/L. The food-to-microorganism (F/M) ratio:
F/M = (Q × BOD) ÷ (V × MLSS) = (1,000 × 220) ÷ (250 × 10,000) = 0.088 kg BOD/kg MLSS·day
This is within the stable operating range for MBR (0.05–0.15 kg/kg·day). Values below 0.05 risk excessive EPS production; values above 0.2 increase fouling risk.
Select a design net flux of 15 LMH. Net flux accounts for downtime during backwashing and relaxation; assume 85% uptime factor.
Gross flux = 15 ÷ 0.85 = 17.6 LMH
Required membrane area:
A = Q ÷ J = (1,000,000 L/d ÷ 24 h) ÷ 17.6 LMH = 2,367 m²
Add a 15% safety margin for peak day flow and fouling reserve:
A_design = 2,367 × 1.15 = ~2,720 m²
Common design trap: Setting initial design flux above 20 LMH for municipal wastewater without pilot data. Higher flux reduces capital cost but compresses the operating window before TMP exceedance and accelerates irreversible fouling, shortening membrane life.
Biological oxygen demand:
O₂_bio = 1.5 × BOD_removed = 1.5 × (1,000 m³/d × 0.22 kg/m³) = 330 kg O₂/day
Standard oxygen transfer efficiency (SOTE) for fine-bubble diffusers in MBR mixed liquor: ~12–18%. Use 15%.
Air for biology = 330 ÷ (0.30 kg O₂/m³ × 0.15) = 7,333 m³/day ≈ 5.1 m³/min
Membrane air scour demand:
Using SAD_m = 0.30 Nm³/h/m²:
Air_membrane = 0.30 × 2,720 = 816 m³/h = 13.6 m³/min
This illustrates a key MBR reality: membrane scouring aeration typically exceeds biological aeration demand by 2–3× in submerged MBR designs. The blower must be sized for the sum.
Total design blower capacity: 5.1 + 13.6 = ~19 m³/min, plus 20% contingency → ~23 m³/min at design static pressure (typically 0.5–0.7 bar for membrane depths of 3–4 m).
When scaling from bench or pilot data, apply these conservative adjustments:
| Parameter | Frequency | Action Threshold |
|---|---|---|
| TMP | Continuous (logged) | Alert at >30 kPa; investigate >45 kPa |
| Permeate turbidity / SDI | Continuous or 2×/shift | Turbidity >1 NTU → check membrane integrity |
| DO (bioreactor) | Continuous | Maintain 1.5–3.0 mg/L for nitrification |
| MLSS | Daily | Outside 8,000–12,000 mg/L → adjust WAS rate |
| Air flow to membranes | Continuous | ±10% deviation → inspect diffusers |
| Permeate flow rate | Continuous | <90% design → check pump and fouling |
Relaxation: Suspend permeation for 1–3 minutes every 10–15 minutes of filtration while maintaining membrane aeration. This is a standard automatic function in modern MBR control systems.
Backwash (hollow-fiber systems only): Reverse permeate flow at 1.5–2× operating flux for 30–60 seconds. Typical cycle: 10 minutes filtration → 30 seconds backwash. Backwash water returns to the bioreactor.
Maintenance clean (CEB — chemically enhanced backflush):
Recovery clean (CIP — clean-in-place):
PVDF vs. PES/PAN compatibility note: Always verify chemical tolerance with the membrane supplier before using high-concentration hypochlorite. PVDF hollow-fiber membranes have higher chlorine tolerance; PES flat-sheet membranes are more sensitive.
Membranes should be scheduled for replacement when:
Typical membrane service life is 5–10 years. Actual lifespan is heavily influenced by influent oil and grease content (should be <50 mg/L at the membrane tank), cleaning chemical aggressiveness, and peak flux violations during operations.
| Symptom | Likely Causes | Immediate Response | Long-Term Fix |
|---|---|---|---|
| Rapid TMP rise (hours) | Sludging, high TSS loading, air scour failure | Check aeration; increase backwash frequency; reduce flux 10–20% | Investigate influent BOD spike; verify WAS rate |
| Persistent elevated TMP | Irreversible biofouling, inorganic scale | CIP cleaning (NaOCl + citric acid) | Review SRT; check Fe/Mn in influent |
| Permeate turbidity spike | Fiber breakage, o-ring failure | Perform pressure decay test; isolate affected module | Replace damaged module; inspect seals |
| Low permeate flow | Fouling, pump wear, header clogging | Inspect pump performance; clean headers | Increase relaxation frequency; review flux set point |
For U.S.-located installations in 2024, total installed CAPEX for MBR systems ranges from approximately $800 to $1,500 per m³/day of design capacity (compared to $400–$800/m³/day for conventional activated sludge without tertiary treatment). The gap narrows when the comparison includes tertiary filtration and UV disinfection needed for reuse-quality CAS effluent.
Key CAPEX line items for a 1,000 m³/day MBR:
| Component | Approximate Share of CAPEX |
|---|---|
| Membrane modules | 20–30% |
| Blowers and aeration equipment | 15–20% |
| Bioreactor tanks and structure | 25–30% |
| Electrical, controls, SCADA | 10–15% |
| Screening and pretreatment | 5–8% |
| Engineering and commissioning | 10–15% |
MBR systems consume 0.8–1.5 kWh/m³ of treated water, compared to 0.3–0.6 kWh/m³ for conventional activated sludge. The difference is primarily attributable to membrane air scour. However, MBR avoids the energy cost of tertiary filtration (typically +0.1–0.3 kWh/m³) and often allows direct reuse without additional polishing.
Energy distribution in a typical MBR:
OPEX components also include membrane replacement (budgeted at $20–$40/m² per replacement cycle every 7–10 years), chemical cleaning reagents (~$0.01–0.03/m³ treated), and sludge disposal. Sludge production from MBR is typically 15–20% lower than CAS at equivalent loading due to the longer SRT, which meaningfully reduces hauling and disposal costs.
| Cost Category | MBR | CAS + Tertiary |
|---|---|---|
| CAPEX (installed) | ~$1.2M | ~$1.4M |
| Annual energy (at $0.12/kWh) | ~$52,800 | ~$36,000 |
| Annual membrane/media replacement | ~$18,000 | ~$8,000 |
| Annual sludge disposal savings vs. CAS | –$12,000 | Baseline |
| 20-year NPV (6% discount rate) | ~$2.1M total | ~$2.3M total |
At small-to-medium scale with reuse revenue potential, MBR is consistently cost-competitive over 20 years. The payback improvement accelerates where land costs are high (urban brownfield), water reuse credits apply, or stringent effluent discharge limits require tertiary treatment regardless of technology choice.
Municipal wastewater and water reuse: MBR is widely used at 0.1–10 MGD plants targeting Title 22 (California) or EPA water reuse guidelines. Permeate TSS is consistently below 1 mg/L, BOD below 5 mg/L, and turbidity below 0.2 NTU — meeting or exceeding most state reuse standards without additional tertiary filtration.
Food and beverage: High-strength organic wastewater (COD 1,000–5,000 mg/L) from breweries, dairy processors, and produce washers responds well to MBR. The ability to operate at elevated MLSS concentrations handles load variability typical of batch food processing operations.
Pharmaceutical: Strict effluent quality requirements for trace organic compounds (APIs, hormones) and the need for reliable permit compliance make MBR + RO a standard configuration in U.S. pharmaceutical facility wastewater treatment.
Industrial water reuse: Chemical, automotive, and electronics manufacturers use MBR as a pretreatment step before RO or nanofiltration, producing an SDI < 3 feed that extends downstream membrane life significantly.
Case 1 — Municipal Reuse, Sun Valley, California (0.75 MGD):
A retrofit from CAS to submerged hollow-fiber MBR reduced the plant footprint by 40%, enabling the site to remain in operation within its existing permit boundary during a capacity upgrade. Permeate consistently met Title 22 unrestricted reuse standards (BOD < 2 mg/L, TSS < 1 mg/L, turbidity < 0.2 NTU), allowing reclaimed water to offset 65% of the facility’s irrigation demand. Reported energy consumption: 1.1 kWh/m³.
Case 2 — Food Processing, Midwest (Industrial, 500 m³/day):
A dairy processor replaced its lagoon system with a containerized MBR to meet revised state discharge limits for BOD and nitrogen. COD removal exceeded 97%, TSS in permeate remained below 2 mg/L, and the plant passed its first post-installation state inspection without condition. The compact configuration fit within the facility’s existing equipment yard with no new land acquisition.
Case 3 — Hotel and Resort Development, Southwest U.S. (0.1 MGD):
A destination resort in an arid region used a packaged submerged MBR to treat on-site wastewater for landscape irrigation under Arizona’s Class A+ reuse permit. The system’s compact form factor (containerized, 40 ft footprint) and minimal operator attention requirement (2 hours/day) made it viable for non-utility management.
When evaluating MBR suppliers for U.S. projects, procurement teams should assess:
Federal requirements:
State-level reuse standards (selected):
Permitting notes: State environmental agencies in CA, TX, FL, AZ, and CO have developed MBR-specific guidance in recent years. Engage your state’s wastewater program early regarding monitoring frequency, membrane integrity testing protocol acceptance, and pilot study requirements for new installations above 0.1 MGD.
Sludge and resource recovery integration: MBR sludge (at long SRT and high MLSS) is well-conditioned for belt press or centrifuge dewatering, typically achieving 18–22% cake solids. Co-digestion with existing anaerobic digesters is feasible; however, MBR’s lower sludge yield means on-site anaerobic digestion may not be economically justified below 2–3 MGD without a co-substrate.
Whether you are evaluating MBR for a new facility, planning an upgrade from a conventional plant, or comparing technologies for a water reuse permit, the next practical step is a site-specific feasibility assessment.
Request a free preliminary design review from Nihao Water and receive:
To get started, share your design flow (MGD or m³/day), influent BOD and TSS, and any applicable reuse or discharge permit limits. Our engineering team can also review pilot or bench-scale data if you have already conducted feasibility testing.
We also offer a downloadable MBR Design Worksheet covering the sizing calculations in Section 2 in an editable format, along with a vendor RFP checklist for procurement teams. [Contact us at nihaowater.com/contact/]
What is membrane bioreactor (MBR) technology and how does it differ from conventional activated sludge systems?
MBR combines biological treatment (activated sludge) with membrane filtration in a single process, eliminating the secondary clarifier used in conventional systems. The membrane acts as a physical barrier that retains all solids regardless of sludge settleability, producing effluent with TSS below 1 mg/L and turbidity below 0.5 NTU — qualities that conventional CAS cannot reliably achieve without additional tertiary treatment.
How does an MBR system operate — what are the key process steps and control parameters?
Wastewater enters the bioreactor where microorganisms degrade organic matter and nitrogen compounds. Mixed liquor flows to the membrane tank, where permeate is withdrawn through hollow-fiber or flat-sheet membranes under slight vacuum. The process is controlled around TMP (target: below 30 kPa), flux (typically 10–25 LMH), DO (1.5–3.0 mg/L in the aerobic zone), and MLSS (8,000–12,000 mg/L). Automated backwash and relaxation cycles maintain membrane productivity between chemical cleaning events.
What is the typical service life of MBR membranes, and what factors influence membrane longevity?
MBR membranes typically last 5–10 years. Key factors extending membrane life include: operating below critical flux, maintaining air scour continuity, keeping influent oil and grease below 50 mg/L, following a regular chemical cleaning schedule, and avoiding TMP exceedance events. Aggressive CIP chemicals and high-chlorine maintenance cleans will shorten life if applied above manufacturer-specified concentrations.
How much energy do MBR systems typically consume in the United States, and what are practical ways to reduce kWh per cubic meter?
U.S. MBR installations typically consume 0.8–1.5 kWh/m³. The most impactful reduction strategies are VFD-controlled blowers (15–25% savings), intermittent membrane aeration cycling (~50% reduction in scour air energy), and flux optimization to operate in the sub-critical range. A well-optimized MBR can approach 0.6–0.8 kWh/m³, bringing it within range of conventional treatment at comparable effluent quality.
What are the common causes of membrane fouling and the most effective cleaning and fouling-control strategies?
Fouling is caused by biofilm formation (biofouling), deposition of organic macromolecules including EPS and SMP, and inorganic scaling from calcium, iron, or silica. Effective control strategies include: regular backwashing (hollow-fiber systems), scheduled maintenance CEBs with hypochlorite and citric acid, optimized MLSS management (avoid exceeding 12,000 mg/L), adequate pre-screening (2 mm or finer), and influent oil and grease removal to protect membrane surfaces.
How do I estimate CAPEX and OPEX for an MBR project, and what payback timelines are realistic for municipal versus industrial applications?
CAPEX ranges from $800–$1,500/m³/day of design flow for U.S. installations. OPEX is driven by energy (0.8–1.5 kWh/m³), membrane replacement ($20–$40/m² every 7–10 years), and chemical cleaning ($0.01–$0.03/m³). For industrial applications with high land costs, strict permit requirements, or water reuse revenue potential, payback periods of 3–6 years relative to conventional treatment plus tertiary are achievable. Municipal projects with longer procurement timelines typically show payback over 8–12 years but benefit from 20-year NPV parity or advantage when tertiary treatment is included in the CAS comparison case.

86-15267462807


86-15267462807
